Day 8: Atomic Beer & exponential fun
August 15th
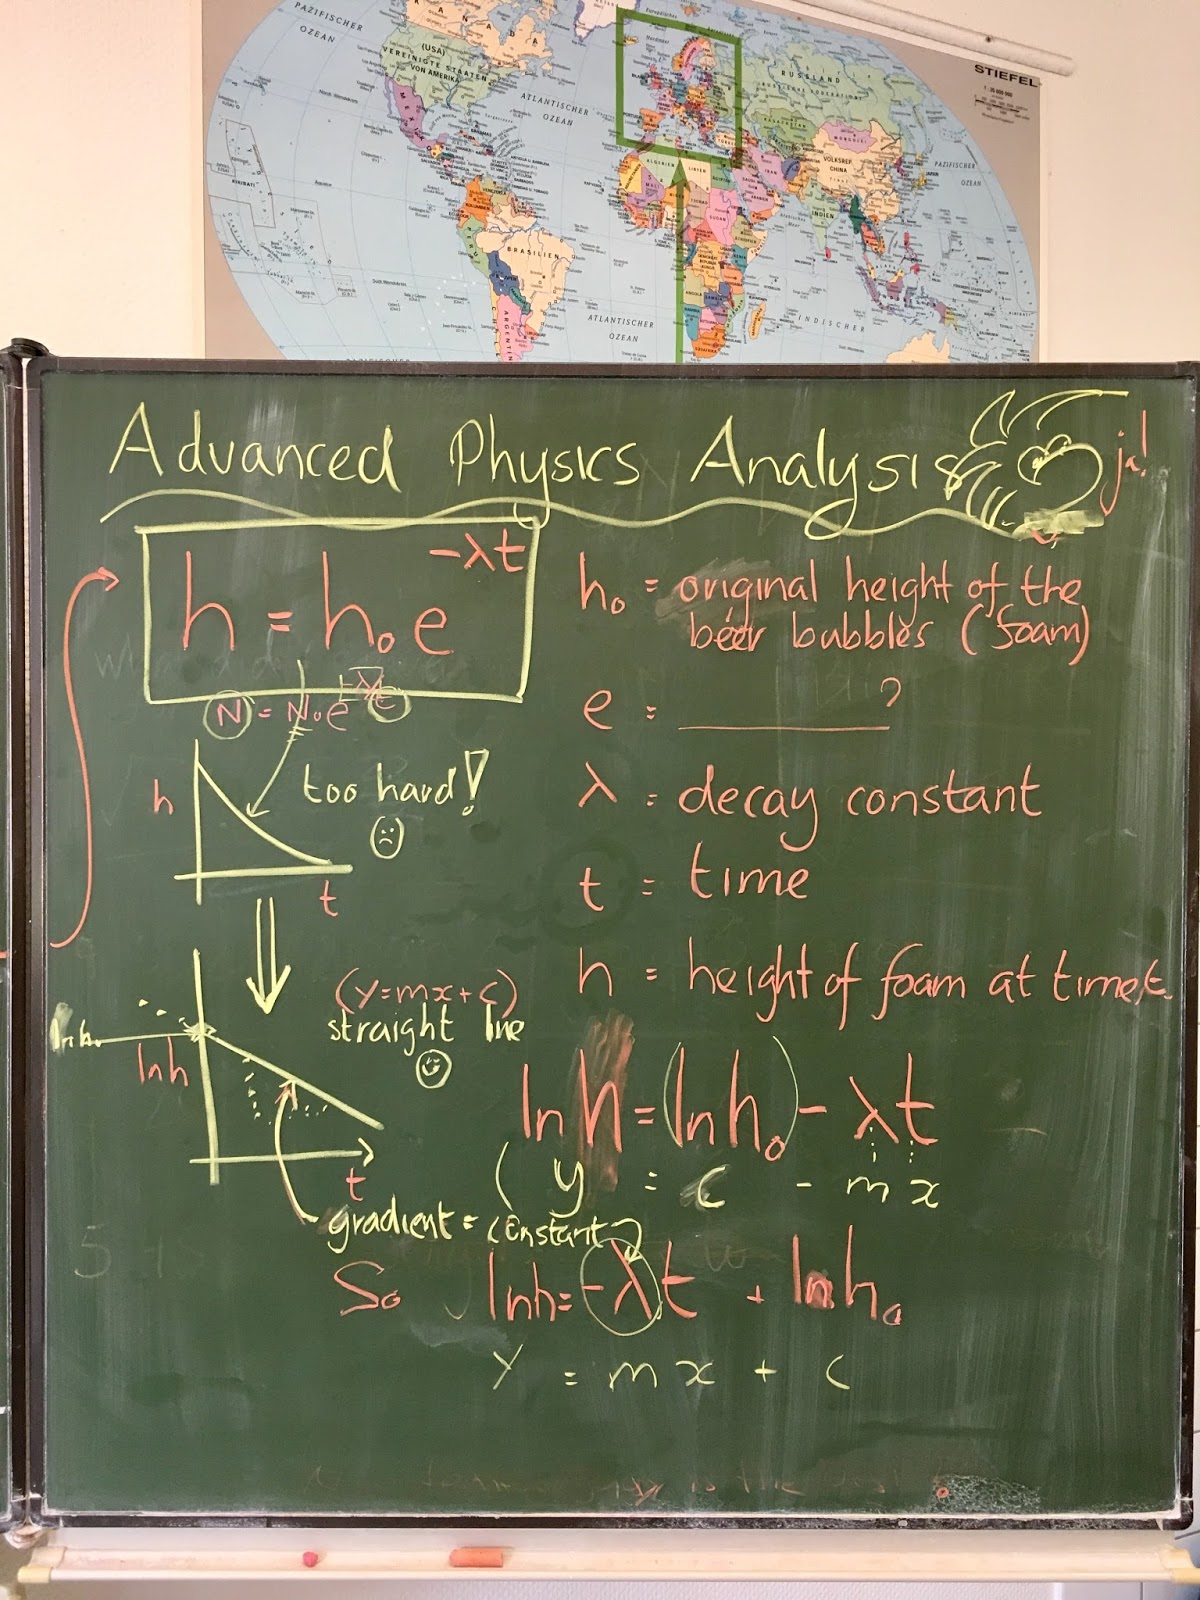
Today´s task was to finish the analysis of our experiment
into the relationship between time and the height of beer foam. Our challenge
was find the half-life and decay constant of the foam, and to prepare posters on which we explained
our task, experiment and analysis. We presented our data in a table and looked
for a pattern in a scatter graph. The graph of height (y-axis, mm) against time
(x-axis, s) showed, we think, an exponential curve which we used to find out
the half-life of the beer foam. Then we calculated the average height along
with its natural logarithm and put the information in a ln h versus t graph.
The graph produced a straight line, which conformed our exponential hypothesis,
and could be described by the mathematical statement: y=mx+c. From the gradient
of this straight line we could estimate the decay constant of our beer foam
head.
After completing our posters at 12:00 o’clock we went to the
back of the castle to take the group photos.
In the afternoon we presented our research methodology and
results, while we were filmed by Nick! The videos can be seen on the blog.
Finally, our group met in the course room where we started to
plan our final presentation. We first agreed on the topics that should be
presented and then assigned a topic to each person.
This was another really great day at the Junoir Academy.
By, Elias Münch


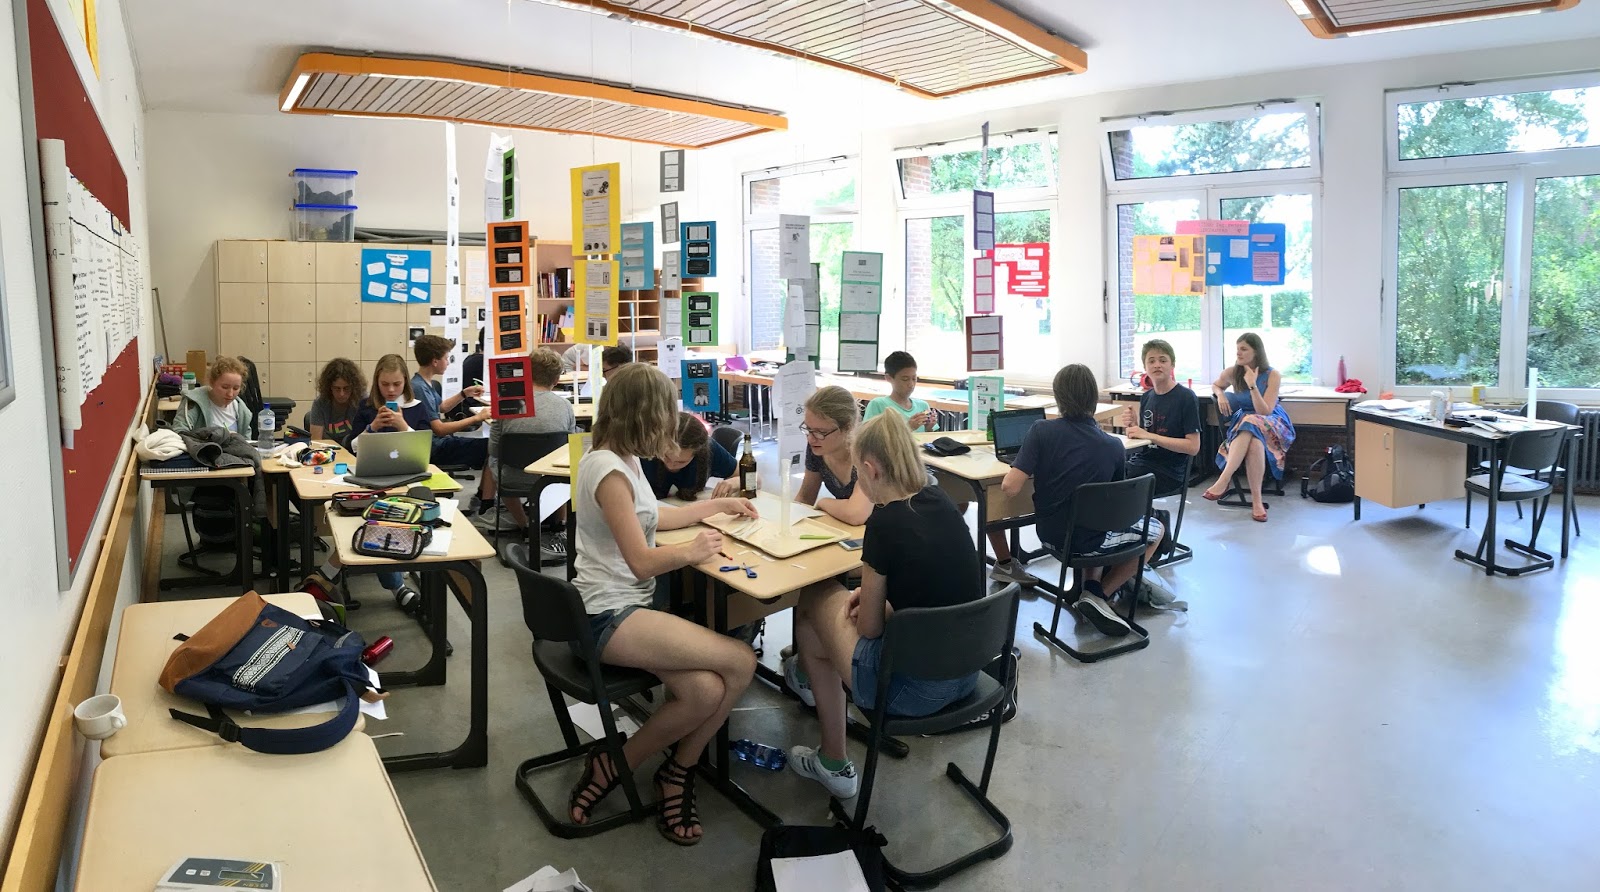


Improvised Presentations of the experimental challenge
The teams were given five minutes to prepare!
Comments
Post a Comment